Ctrl+K

anyplotlib

  • Getting Started
  • Event System
  • Embedding outside Jupyter
  • API Reference
  • Examples
    • Performance
    • Benchmarking
    • Developer Documentation
  • GitHub
  • Getting Started
  • Event System
  • Embedding outside Jupyter
  • API Reference
  • Examples
  • Performance
  • Benchmarking
  • Developer Documentation
  • GitHub

Section Navigation

  • Benchmarks
    • Plot Update Comparison
  • Interactive Examples
    • Interactive figure annotations — double-click to add, drag to place
    • Draggable Point Widget
    • Key-Press Widget Placement
    • Live intensity thresholding on a multi-phase STEM image.
    • Inverse Pole Figure (IPF) Explorer
    • Interactive FFT ROI
    • EELS multi-spectrum explorer.
    • Interactive 3D Spectral Viewer
    • HAADF STEM nanoparticle picker.
    • Interactive Contrast Segmentation
    • ROI-to-spectrum inspector for a 3-D EDS hyperspectral dataset.
    • Inverse Pole Figure (IPF) Density Map
    • 3-D Voxel Grain Explorer
    • Interactive 1-D Gaussian Fitting
    • Advanced Interactive Contrast Segmentation (3 × 3 Grid)
    • Star Globe Explorer — a linked celestial sphere and sky map
  • Markers
    • Horizontal Lines
    • Vertical Lines
    • Points
    • Text Labels
    • Arrows
    • Circles
    • Rectangles
    • Line Segments
    • Ellipses
    • Squares
    • Polygons
    • Coordinate transforms — pin markers to the axes or the screen
  • Plot Types
    • Step lines and log-scale spectra
    • Twinned (secondary) y-axis
    • Label Sizes and Scientific (TeX) Formatting
    • 3D Plotting
    • GPU-accelerated voxels
    • pcolormesh — non-linear axes
    • 1D Spectra
    • Inset Plots
    • 2D Image with Histogram
    • 1D Line Styles
    • Bar Chart
    • Floating keys — IPF triangles and colour wheels
    • Custom Grid Layouts with GridSpec
    • Custom Tile Backend — pan & zoom a huge image you never hold in memory
    • Textured 3-D surfaces — a celestial globe
  • Widgets
    • 1D Horizontal Line Widget
    • 1D Vertical Line Widget
    • 1D Range Widget
    • 2D Crosshair Widget
    • 2D Circle Widget
    • 2D Rectangle Widget
    • 2D Annular Widget
    • 2D Label Widget
    • 2D Polygon Widget
    • 1D Point Widget
    • 2D Arrow Widget
    • 3D Plane Widget
  • Examples
  • Markers

Markers#

A collection of short examples using markers
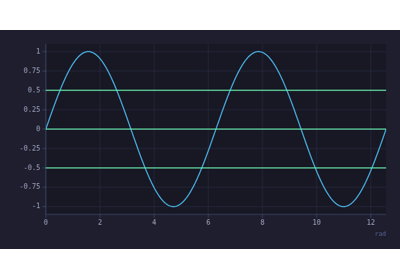
Horizontal Lines

Horizontal Lines

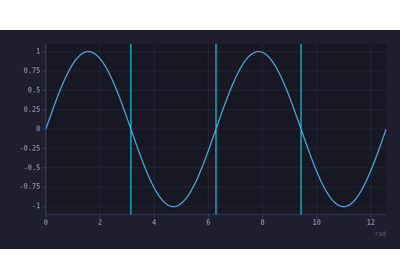
Vertical Lines

Vertical Lines

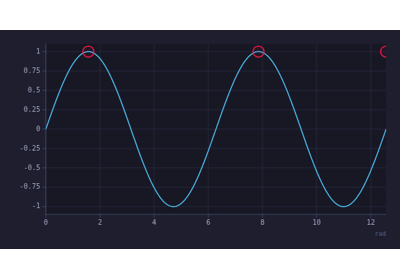
Points

Points

Text Labels

Text Labels

Arrows

Arrows

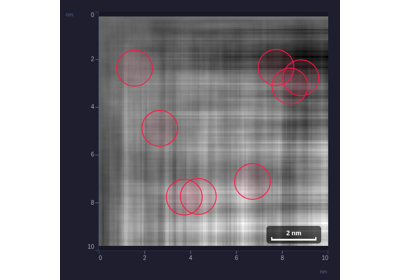
Circles

Circles

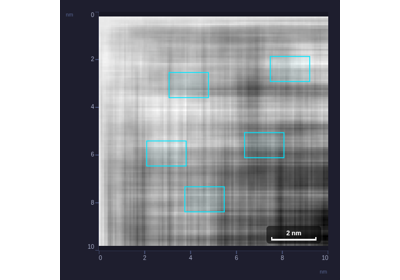
Rectangles

Rectangles

Line Segments

Line Segments

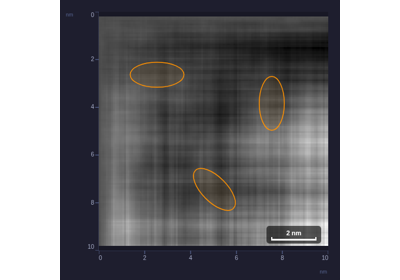
Ellipses

Ellipses

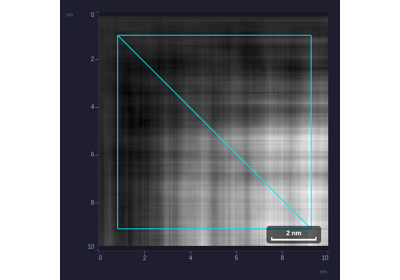
Squares

Squares

Polygons

Polygons

Coordinate transforms — pin markers to the axes or the screen

Coordinate transforms — pin markers to the axes or the screen

previous

Star Globe Explorer — a linked celestial sphere and sky map

next

Horizontal Lines

Show Source

© Copyright 2026, anyplotlib contributors.

Created using Sphinx 9.1.0.

Built with the PyData Sphinx Theme 0.17.1.