Examples#
A collection of short, self-contained examples.
Benchmarks#
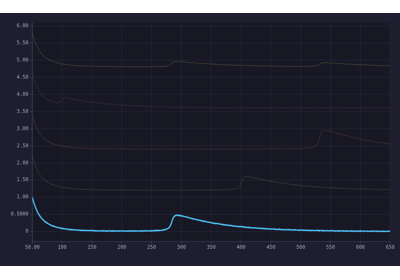
Timing comparisons for the Python-side data-push pipeline in anyplotlib, matplotlib, Plotly, and Bokeh. All measurements capture only the Python serialisation cost — the bottleneck in a live Jupyter session where new data must be encoded and dispatched to the browser on every frame.
Interactive Examples#
Examples that use the callback / event system to connect widget interactions to live Python computations.
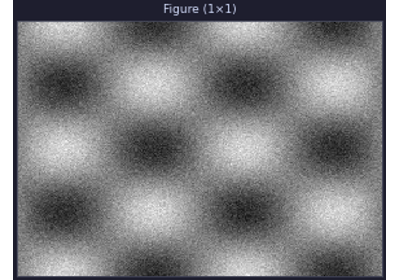
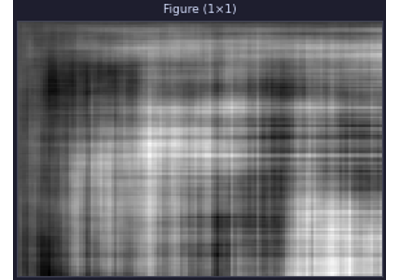
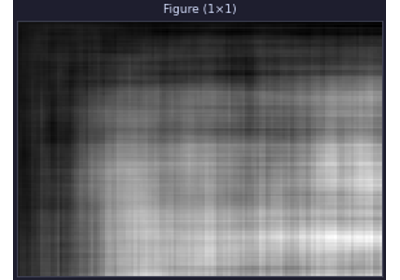
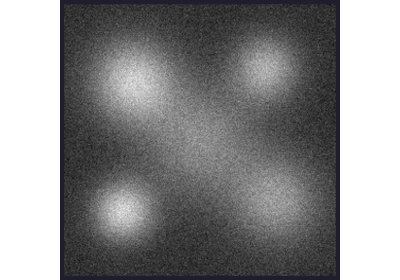
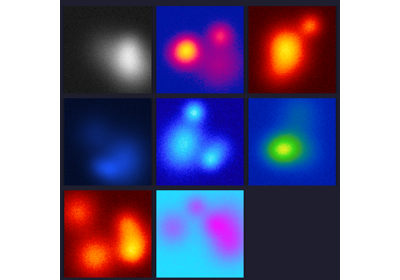
Live intensity thresholding on a multi-phase STEM image.

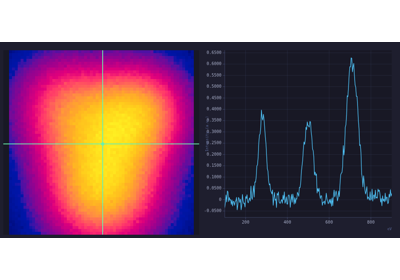
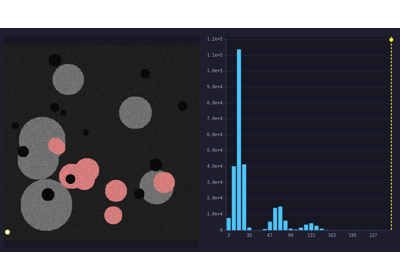
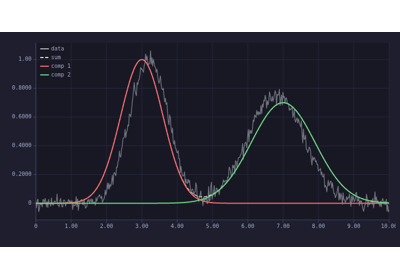
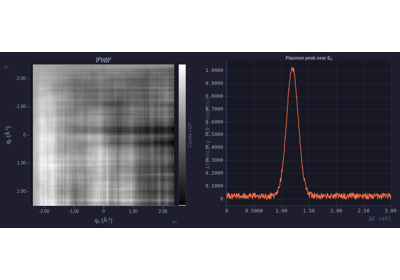
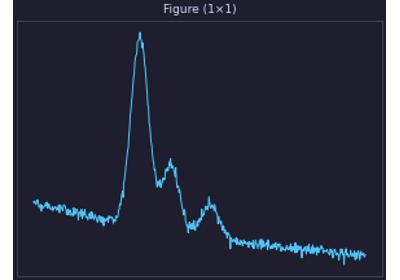
ROI-to-spectrum inspector for a 3-D EDS hyperspectral dataset.
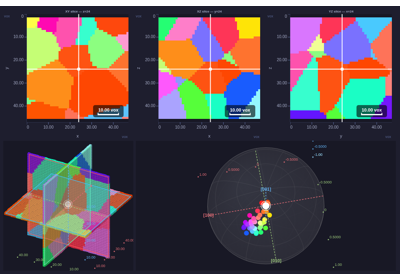
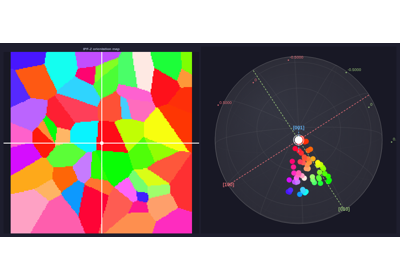
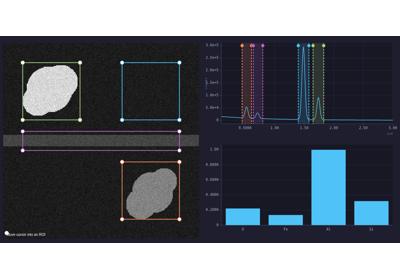
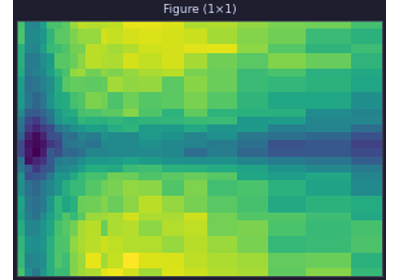
Advanced Interactive Contrast Segmentation (3 × 3 Grid)
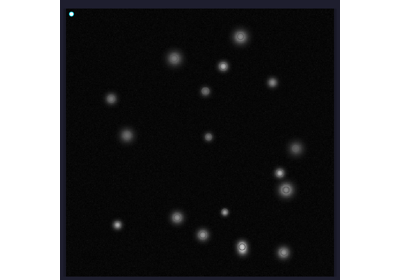
Markers#
A collection of short examples using markers


Plot Types#
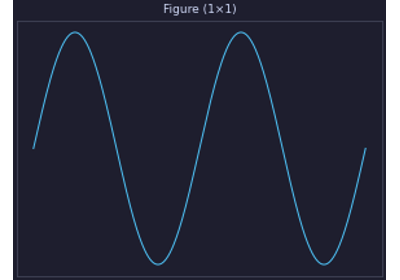
A collection of short examples showing different plot types.

Widgets#
Short examples of using widgets in anyplotlib